
By Brian Callnan

Peak energy demands have been getting pushed to the nighttime. March through June of 2026 all had peak energy use between 9 and 10 PM, well after the sun had set.
What is a Duck Curve and Why Are We Talking About It?
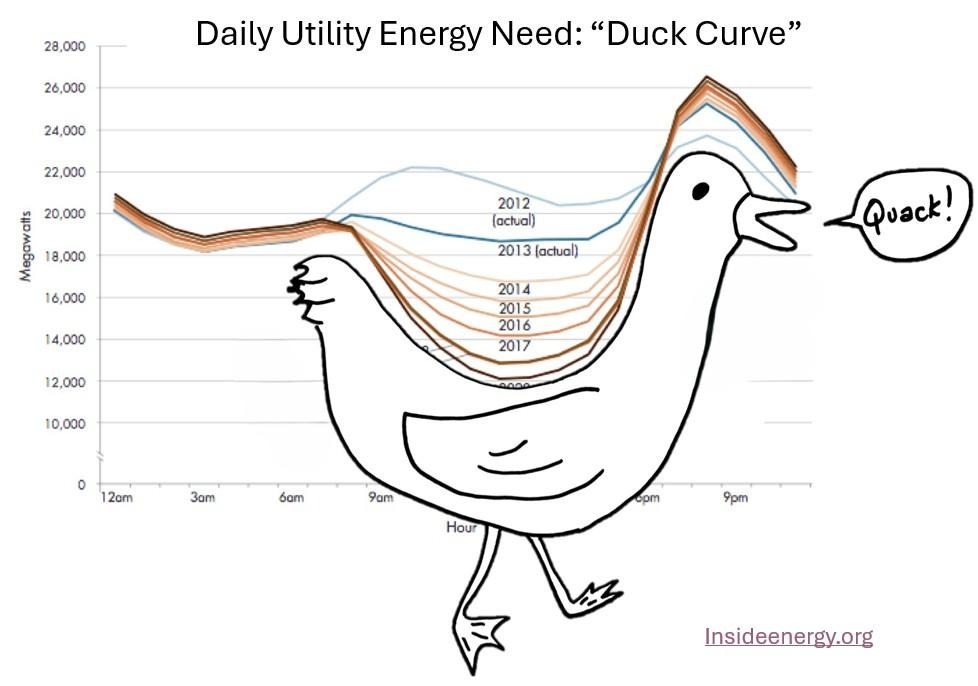
I’m not sure who first came up with the name “Duck Curve,” but it seems to fit (if you give the artist a little leeway with the duck’s back). The first graph shows energy needs throughout the day for California from 2012 to 2018. You can see that the amount of energy needed in the middle of the day is a lot lower than what is needed in the morning and in the evening.
Why is this happening? California was an early adopter of solar energy. The more solar panels installed, the less the state needed to find energy from other sources — just as planned. What was harder to forecast was how this would impact two things that utilities think about a lot: high energy prices and peak demands on the grid.
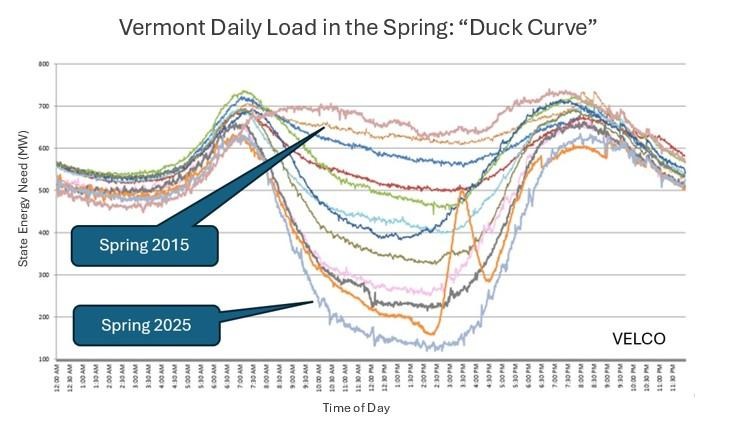
Before we dive into that, let’s take a look at our own nest: Vermont. The Vermont graph looks similar to California’s. It shows how our energy needs have changed over the last 10 years as investment in solar resources increased. Pretty soon we may find that all of our energy needs in the daytime are met by solar energy — that Spring 2025 line is getting close to zero. When that happens, we will need to send energy to neighboring states because we can’t use it.
So What Does This Do to Energy Prices?
The good news is, the abundance of solar power lowers prices regionally when solar is producing. The Spring 2025 line in the graph represents energy usage on April 8, 2025. A graph of energy prices had a similar shape that day. The highest energy costs were in the morning and early evening, and the lowest energy costs were in the middle of the day, when solar was producing.
If you need to buy energy, this is great: it’s a buyer’s market. These days, WEC doesn’t need to buy much energy during the middle of the day, because a lot of our members are producing energy with solar panels they own privately. Sometimes we have so much solar energy flowing onto our grid, we need to sell it to the regional market at low prices, creating a loss for WEC that needs to be absorbed in electric rates.
What About Peak Demands on the Grid?
This is a little more complicated. Three major things have changed since the first year in since the first year in the graph “Vermont Daily Load in the Spring” (page 1).
First is that our transmission costs have gone up significantly. It takes infrastructure and capacity for regional generators to transmit electricity to distribution utilities’ substations, including WEC’s. Our transmission costs are based on how much energy we use when statewide energy use is at its highest, or peak, each month. If statewide energy use was a bird’s nest, the less room we take up in the nest during peak periods, the lower our transmission costs.
We now rarely see monthly peaks when solar is generating. Peak energy demands have been getting pushed to the nighttime. March through June of 2026 all had peak energy use between 9 and 10 PM, well after the sun had set. New solar installations no longer help reduce our peak demands during most of the year.
A second major change has been to the operation of our substations. WEC’s substations were originally built to import the amount of energy members needed. Now, with about 10% of our members owning solar, we export more and more energy out of our distribution system during the middle of the day.
All of our substations are now seeing “reverse flow” on their equipment. It’s called “reverse flow” because the energy is going a different way than originally designed. Sometimes this “reverse flow” approaches the total capacity of the substation. When this happens, we need to limit new uncontrolled solar installations. This is happening at our Jackson Corners substation in Williamstown: the substation is being upgraded to handle all the energy being exported, and can’t absorb energy from new solar installations until this is complete. We are committed to upgrading many of our substations, but it’s not necessarily because WEC members need more energy; it’s because we need to make sure we can export all the energy from the solar being installed.
Third, we have seen New England regional grid operators develop new tools to meet all regional power customers’ changing energy needs. The steep demand for energy as the sun starts to set is new, and means that it’s become important to have generators that are able to start quickly in reserve. In some cases, the amount of generation supplying energy to the grid needs to double in just a couple of hours. Demand also increases on cloudy days, so there has been an increased focus on improving forecasting. Better forecasting means units in reserve don’t need to ramp online as quickly.
We’ve gone over how solar production lowers market prices mid-day. Sometimes regional energy prices actually go negative. When this happens, WEC gets paid to use energy, not produce it, and generators have to pay for excess energy they produce. If a generator can, they will stop producing energy as quickly as possible to minimize their losses. Overall, the region is adding new markets and processes to help manage the “Duck Curve” and other changes to energy demands.
How is WEC Responding to These Changes?
Your Co-op is not just sitting around preening its feathers while the energy landscape changes. We are actively working to minimize the costs to members from these changes, and increase the benefits.
- Stay tuned for WEC updates regarding utility-scale and home battery programs. Batteries are very flexible, giving WEC the ability to meet new energy demand needs quickly.
- We have modernized our PowerShift program to shift participating members’ EV charging to daytime and late evening times to avoid high cost periods. More and more members are choosing electric vehicles, and PowerShift helps to incentivize this choice while minimizing the power costs to meet increased demand.
- We are installing advanced meters. This infrastructure will give us the ability to set time of use rates to help lower members’ bills as well as reduce energy costs during the day and late in the evening. This will help lower overall costs for everyone.
- We continue to stay active on the regulatory front. Providing help to regulators when designing price signals (like net metering) ensures that we are encouraging energy to be used when costs are low and produced when costs are high.
It’s a changing world out there and your Co-op is changing right along with it — a solution that really fits the bill.
Brian Callnan is WEC’s Director of Power Supply and Regulatory Affairs
For a Closer Look at Duck Curve Graphs:
California Duck Curve graph: InsideEnergy.org, illustrated by Jordan Wirfs-Brock. https://insideenergy.org/2014/10/02/ie-questions-why-is-california-trying-to-behead-the-duck/
Vermont Daily Load in the Spring graph: VELCO, featured in the Department of Public Service’s 2026 Annual Report. https://publicservice.vermont.gov/sites/dps/files/documents/2026_Annual_Energy_Report_1-15-2026.pdf